Showing posts with label science. Show all posts

Tuesday, March 21, 2017

A Heart to Heart Talk

Several billion years ago, a bright red star the size of Earth's orbit beat like a heart in a spiral arm of the Milky Way galaxy. Already billions of years old, this star had long since fused all the hydrogen in its core into helium. Eventually, the star grew hot enough that the helium ash could begin to burn, slowly transforming the core to carbon and oxygen. When helium in the core finally ran out, the billion year balance between gravity and radiation that every star battles to maintain gave way, and the core contracted and grew hotter. Feeling the heat, the outer envelope expanded and cooled, and a red giant was born.

This giant soon found a new, but ultimately short-lived balance in a period of its life known as the asymptotic giant branch (AGB) phase. Now, a thin shell of hydrogen surrounding the core grew hot enough to burn, producing a new layer of helium that settled onto the core. After tens or hundreds of thousands of years, the helium layer grew hot and dense enough to start its own fusion cycle, leading to a brief helium shell flash. In those moments, the star's brightness would jump by a factor of a thousand before returning to its quiescent, hydrogen-shell burning stage. This was the slow beat of the giant's heart.

Credit: Lithopsian
How do we know this story about a giant, pulsating star that died long before ours was born? We have observational and theoretical evidence that stars like this exist. With telescopes, we have found stars with masses comparable to our own that are tremendously brighter but cooler (on the surface). To be so bright yet cool, such stars must occupy a very great volume. We have also built models of stellar evolution by observing many different stars and figuring out how ones that look different might just be the same kind at different stages of life.

But what about this specific red giant from billions of years ago—how do we know about it? What lets us peer into its heart? Well, we don't know its name or where the cooling remnant of its core is now, but we do know this star was part of a lineage, inheriting the cosmic dust from previous stars and passing it on to us, but transformed. In the roiling convective envelope that surrounded the core of this red giant, there were atoms of iron built by some older star's fusion.

Iron is the endpoint for fusion that can power a star. For all elements with fewer protons than iron, smashing them together at high enough temperatures and densities liberates more energy than is required to do the smashing. But this doesn't work after iron, because you've got so many positively charged protons squished into such a small space that they strongly resist any further squishing. You can still do it, but you're losing energy. Nevertheless, this type of fusion does happen in the outer layers of dying stars, draining a bit of the star's energy with each reaction.

This process of building up elements in stars—known as stellar nucleosynthesis—was first described comprehensively in a famous astrophysical paper known as B2FH (after the initials of the four authors). In it, they gave a detailed account of the nuclear physics required to produce all the elements we see in nature. Spectrographic analysis of our star and ancient meteorites that existed in the early days of the solar system has largely confirmed that elements do exist in the proportions dictated by stellar nucleosynthesis.

But let's get back to the iron in that giant. Here, a type of nucleosynthesis known as the s-process was dominant. One way to build new elements is to bombard atoms with neutrons. Every once in awhile, an atom will capture a neutron and become a radioactive isotope of whatever element it is (as determined by its number of protons). Eventually, beta decay will turn one of the neutrons in the nucleus into a proton, which then bumps that atom up to the next element in the periodic table. This process starts with iron and ends with bismuth.

As you can see, there are two reactions going on here: neutron capture and beta decay. Because of this, the rate at which these reactions occur determines the eventual abundance of elements we see. In AGB stars, neutron capture happens much more slowly than beta decay, which means that we will eventually see a ladder of elements building up from iron rather than more and more weird isotopes of iron.

Let's look at one element in particular to see how this whole thing works. The element thallium has 81 protons and shows up in nature with either 203 or 205 total nucleons (protons+neutrons). 204 nucleons is unstable and decays with a half-life of less than 4 years. That means there is a branching point when thallium reaches 204 nucleons. From there, it can undergo beta decay and become lead with 82 protons, or it can capture another neutron and remain thallium. About 70% of thallium is the 205 kind, while 30% is the 203 variety. (There is more thallium-205 because lead-205, which you get to by thallium-205 or lead-204, is unstable over millions of years and eventually decays back to thallium-205.)

Credit: R8R Gtrs
By experimentally determining how likely thallium is to capture a neutron and how quickly it decays, we can infer how often atoms of thallium in that red giant were being bombarded with neutrons. Knowing the density of neutrons in the AGB star tells us what nuclear reactions were creating neutrons and consequently how hot the core of that star was and what elements it was composed of. It turns out that the abundances of elements we see would require a range of neutron fluxes, which is part of how we know that AGB stars undergo pulses of helium fusion before returning to hydrogen-shell burning.

Because AGB stars are about as large as Earth’s orbit but of comparable mass to our sun, their gravity is not strong enough to contain their extended envelopes. This means much material is lost, becoming a "planetary nebula" and eventually dispersing into interstellar space. That includes the products of nucleosynthesis, which come to pollute cold, giant molecular clouds.

About four and a half billion years ago, one such polluted cloud became unstable and collapsed. Out of that collapse was born our sun and solar system. As Earth formed and mixed together the metals that could withstand the searing heat of our young star, atoms of thallium got locked up in minerals of copper and lead and zinc.

Eventually, humans came along and started extracting pure thallium to do things with it, such as performing experiments that could give us insight into the hearts of long-dead stars. A week or two ago, some pure thallium-203 was bombarded with protons until it became lead-201, which has a half-life of 9.4 hours. The lead decayed into thallium-201, which has a half-life of 73 hours. Because of that short lifetime, the thallium must be prepared and used quickly. This specific batch was mixed with hydrochloric acid to produce thallium chloride, which was then put into a solution and packaged for use.

Four days ago, that radioactive thallium was injected into my veins. Because thallium behaves a bit like potassium as far as cells are concerned, sodium-potassium pumps in the membranes of cardiac cells take in the thallium. These pumps transport ions of sodium and potassium, creating a voltage that gives cardiac cells the electricity they need to beat. Cardiac cells that are working well have functioning pumps and will take up the thallium; cells that aren't won't. To make sure the thallium was well circulated in my heart, they had me run on a treadmill until I got to 160 bpm.

Thank you, Frinkiac.
To see where the thallium in my blood ended up, a camera took pictures of the gamma rays streaming out of my body. But gamma rays present something of a problem. In a normal camera, a lens focuses light rays onto a surface to form an image. In telescopes, we mostly use mirrors to bounce light in the direction we want. This doesn't work with gamma rays, however. Their incredibly short wavelength means that for everyday materials, they will either be absorbed or transmitted, but not redirected. When a photon is simply absorbed without any optics, information about where the photon comes from is lost and you no longer have an image.

Astronomers have devised many clever techniques for getting images from x-ray and gamma ray sources, one of which works for looking into hearts, too. You can preserve the image of a source by creating a very small aperture for light to pass through—a pinhole camera. On the other side of that pinhole, you have a detector. Because you can trace just a single line from where a photon hits the detector to the pinhole, you know what angle that photon came in at and thus know what the original source of the image was. The downside to a pinhole camera is that almost all of the light is blocked. To get around this, you can create an aperture with a very specific shape that lets in more light but leaves a distinct "shadow" on the camera. Using computational techniques, you can than reconstruct the original image.

Credit: Alex Spade
The camera they used rotated around me for eight minutes, producing cross-sections of my heart at different angles that were later combined to form a 3D image.

I don't yet know the results of that test (although I suspect I am okay), but I am comforted by the thought that the thallium used to peer into my heart can also peer into the hearts of long-dead stars, to give a glimpse of another world, an incomparably gigantic furnace burning at hundreds of millions of degrees that does its part in seeding the galaxy with the elements necessary for chemistry and life. I am also comforted to know that I am a part of that lineage, that my carbon was produced in another dying star, that the hydrogen in my water is nearly as old as the universe itself. I hope this specific agglomeration of carbon and water persists a bit longer, but I am happy nonetheless that the universe is eternal and spectacular and knowable.

Friday, September 4, 2015

Here's Where the Fun Begins

Hey guys. Remember me? Yeah, I haven't done any writing (fiction, blogging, or otherwise) in quite a while due to life being somewhat chaotic of late. I'd like that to change, so here's a quick blog post just to make sure I haven't forgotten how to type.

So I'm almost done with my first week of class, and I have now been to (or watched) at least one lecture for all of my classes. In the order in which I did so, here's a brief summary of said lectures followed by some general commentary. Man, this sounds exciting. I wish it were possible for Statcounter to track the exact paragraph in which my readers decide to leave the page.

Monday morning I had Quantum Physics I, which is an introductory course in quantum mechanics. Intro QM courses often seek to get students to develop some intuition for the quantum realm, which is quite counter-intuitive compared to the well known land of blocks sliding across incline planes. To develop this intuition, professors have students solve the Schrodinger equation again and again and again until their dreams are nothing but operators and wavefunctions.

To that end, the textbook we're using is Griffiths, which is apparently the text almost all intro QM classes use. Page one of that book writes down the Schrodinger equation and simply plows ahead from there. My professor thinks this is actually kind of a dumb way to go about things, so we're beginning the semester with the story of how quantum mechanics came to be.

Now, having been a science dude for quite some time, this is a story I've heard a lot. I'm getting some math to go along with it this time, but in general the story of quantum mechanics goes something like this:

Near the end of the 19th century, the kingdom of physics was at peace. Two centuries earlier, the father of physics, the great Sir Isaac Newton, had discovered the Stone of Counting, Calculus (this is a really funny joke), and used it to tame the very moon itself. Later, Maxwell forged together electricity and magnetism to bring light to the world. And Boltzmann conquered heat with entropy. Plus maybe some other things happened in the intervening two centuries.

But then evil blackbody radiation from the quantum realm brought about the ultraviolet catastrophe. Using classical thermodynamics, physicists predicted that hot objects would emit an infinite amount of energy at low wavelengths. Oh no! But then Planck saved the day by creating oscillators that only emitted and absorbed radiation in discrete chunks. Forced to obey a Boltzmann distribution, these oscillators were too few in number at low wavelengths to bring about divergent infinities.

Yet this was a false peace. Where did these quantized oscillators come from, and why did they only act in multiples of Planck's constant? Tune in next time to find out. (That's as far as we got in lecture. The rest of the story involves the photoelectric effect, emission lines, and some other stuff, but this post is already 8 paragraphs long and I'm only on my first class. Maybe I'll write a children's book about quantum mechanics.)

Tuesday morning (I have another class on Monday, but it's a discussion section and didn't meet the first week) I had Philosophy of Physics. This class is taught by a Distinguished University Professor who got a PhD in Mathematical Physics several centuries ago but then decided to go into philosophy for some reason. It turns out this class is mostly going to be talking about the "weirdness of quantum mechanics," which should make it a nice complement to that other class where I'm just going to "shut up and calculate."

Weirdness, though, is not about how maybe we're all really connected and you can change the world just by looking at it and other quantum woo like that. To this professor, the weirdness of quantum mechanics arises from an SAT-like analogy. Relativity is to space-time as quantum mechanics is to information. That is, Einstein taught us that space and time aren't what our intuition leads us to think they are, and QM does the same for information. Information, which has roots in probability theory, works differently than we think it does and the consequence is that quantum stuff can be correlated in ways that classical stuff can't. I think this is going to be pretty interesting.

Both my quantum classes were prefaced with a quote from Feynman about how nobody understands quantum mechanics. My QM professor thinks this isn't really true anymore and that the results of QM speak for themselves, whereas my philosophy professor thinks we might be getting close to an understanding via thinking about information theory.

Right after that I had Ancient Philosophy. I'm taking this class mostly because I need a history of philosophy credit for my philosophy minor, but also because I want to learn about some of the lesser known ancient Greek philosophers (Pre-Socratics, Stoics, Epicureans, etc.). And the text is chock full of readings from/about those philosophers. It was a shame, then, to learn that the instructor will mostly be teaching us about the moral philosophies of Plato and Aristotle. Yeah, that's good stuff. But doesn't everyone know that Plato's utopia is a dictatorial city-state run by wise philosopher kings? Sigh.

After a morning of philosophy came Observational Astronomy, which is the next required course in the astro sequence. This course is less about what's out there in the universe and more about how we come to learn about what's out there. We'll be studying optics, image processing, celestial coordinates, statistics of signal and noise, and how CCDs work. The biggest chunk of this class grade-wise is some observational projects where we have to take data from the observatory and process it into something useful and meaningful. That's pretty awesome.

Wednesday morning was another lecture of QM. Wednesday afternoon I had Solar System Astronomy. Like ancient philosophy, I'm taking this course mainly because I need a number of upper level astronomy courses to fulfill my major. I'm not super-interested in solar system stuff, but for some reason I'm trying to graduate next spring (it might have something to do with me turning 30 in a couple months...), which means I kind of have to take what's available. Also like Ancient Philosophy, I learned during the first class that this won't be a wide-ranging course about all aspects of the solar system, but will focus mostly on planetary geology, delving into the planets and other rocky bodies that inhabit our sun's domain.

After some thought, I realized I'm actually pretty okay with this. The one novel for which I have something approaching a rough draft spends a lot of time on Ceres and Europa, two big spheres about which I am not all that qualified to say much, despite the number of Wikipedia articles I've read. So, you know, getting a grounding in how these kinds of worlds really work might improve my ability to write about the things I'm already writing about. Or it just might make my infodumps that much more painful. We'll see. Either way, this course involves a term paper about some topic in solar system astronomy, so I'll definitely be writing.

Thursday was identical to Tuesday, and I'm writing this Friday morning, but Friday is essentially identical to Wednesday. The only class I haven't talked about is an online one, Theory of Knowledge. This is an intro philosophy course in epistemology. The course probably technically started Monday, but due some technical glitches (the course is being hosted on the professor's personal website, which he coded himself), I wasn't able to watch the first video lecture until Thursday evening.

During that video, the professor talked about the benefits of online courses, such as the freedom to edit lectures into conveniently sized chunks by excising parts that aren't helpful. Also during that video, the professor gave instructions on how to access his site in a video that his students could only be watching if they had successfully accessed his site.

Anyway, I'm pretty excited about this course. Epistemology is a fascinating subject to me as it acts as a bridge between thinking about the world and knowing about it. The basic stance of modern epistemology is that knowledge is "justified true beliefs." But how do we know if a belief is true? And how can we justify our beliefs? And what does it actually mean to believe something? Epistemology asks and attempts to answer all these questions, and it does so in surprisingly technical ways, invoking psychology, neuroscience, Bayesian statistics, and other pretty modern tools.

Week 9 of the course examines the philosophy of psychedelic transformations. (But it's a 15 week course, so I'm okay with a brief excursion into eye-rolling territory.)

And that about does it. This is going to be my busiest, toughest semester since I returned to school for real in 2012. I've got 19 credits of 300 and 400 level classes. Plus I'm working.

As far as general commentary, I have two things to say. The first is a pattern that may be a coincidence or may be indicative of what happens at this level. My observational astronomy, quantum physics, and epistemology classes are all prereqs for more advanced topics. And all of those professors are covering a lot of ground that is necessarily going to be somewhat outside of their precise areas of expertise.

On the other hand, my ancient philosophy, philosophy of physics, and solar system astronomy courses mostly stand on their own and don't lead explicitly to anything else. And my instructors in those classes have chosen to focus on a particular branch of each field that happens to coincide with their research interests. Coincidence? Probably not. But it does mean I may want to pay more attention to which teachers are teaching which classes when I decide to take free-standing, upper level courses.

My other comment is that most of my instructors (this semester and previously) talk pretty openly about pedagogy, which I think is a good sign. One of the stereotypes of college is the ancient professor who stares at the blackboard with chalk in hand, talking nonstop for the duration of the lecture and paying little heed to any students who might also be occupying the classroom. My college career thus far has been largely absent that phenomenon, and I suspect the apparently institutionalized focus on pedagogy is partly responsible for that. So yay.

Sunday, April 12, 2015

If the Sequence Fits...

Okay, we're doing an old-fashioned blog post today, wherein I recount one of my recently completed labs. The lab portion of this semester's classes comes from my astrophysics course. This might seem a little weird, because we don't all have telescopes at our lab benches.

Hello, Edwin Hubble.
Instead, we're given data that we must analyze via Matlab. Interestingly, this is probably a bit closer to what real astronomers do, because astronomy today is less peering through a telescope in the wee hours of the night and more writing code to make sense of numbers sent to you from an observatory in New Mexico or Chile or space.

Hello, Hubble Space Telescope.
I've decided to blog this particular lab because I think it has the most interesting plots, which might be just the kind of statement required to turn away what few readers I have left. Specifically, we're looking at Hertzsprung-Russell diagrams, which are a very peculiar kind of graph astronomers use to confuse laypeople. Here's what they look like according to wiki:

Thanks, Wikipedia.
So the x-axis represents temperature, and higher temperatures are to the left. On the y-axis we have luminosity, which increases as you go up. What makes these diagrams strange is that it's not immediately clear what they tell you. Are you looking at different classes of stars? The same star at different times in its life? Stars at different distances (and thus ages) spread out all over the place? The answer is yes.

If you simply point your telescope at the sky, find a bunch of stars, and plot them on an H-R diagram, the only thing you will know with any certainty is that they're not all the same star. To get useful information from this diagram, you have to be specific about what you're looking at.

For this lab, we were looking at open star clusters, which are groups of stars that all formed from the same giant molecular cloud (real term). If that's true, then you can assume that all of the stars in the cluster are roughly the same age and roughly the same distance away from you. If you plot a cluster on an H-R diagram, a particular feature suddenly pops out: that big diagonal line called the the main sequence.

From astrophysical theories, we know that stars on the main sequence are those that are burning hydrogen in their cores. This is what our star is doing; it's what most stars that we look at are doing. Eventually, as a star gets older, it burns through all of the available hydrogen in its core and moves off of the main sequence (top right-ish) and becomes a giant of some sort, and then much later stops fusing at all and becomes a stellar remnant like a white dwarf (bottom left-ish).

What the existence of something like the main sequence means is that if a star is burning hydrogen in its core, and it's at some particular temperature T, then it will also be at some particular luminosity L. One demands the other. There is a pretty concrete relationship--for a main sequence star--between its mass, temperature, luminosity, and lifetime. Bigger stars burn brighter and hotter, go through their fuel more quickly, and thus leave the main sequence sooner.

But as I said earlier, if you just point your telescope at a bunch of stars, it's hard to know what you're looking at. In fact, the only information you get from a telescope about a star is how bright it is, and brightness is a result of a star's intrinsic luminosity as well as its distance from you. The farther a way a star is, the dimmer it is. Because of that, you don't always know if you are looking at a bright star far away or a dim star close to you. So how are we able to figure out a star's luminosity and temperature?

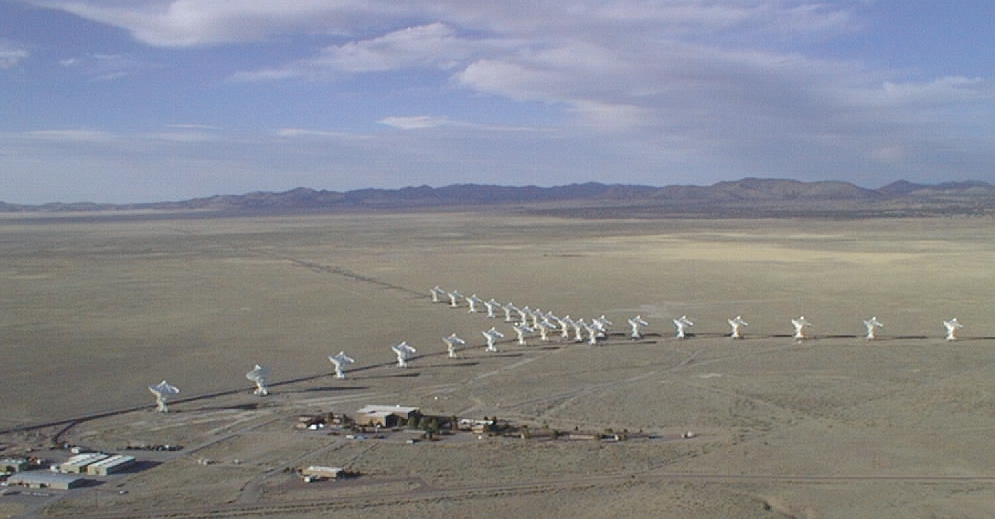
By restricting how we look at the star. Another difference between the popular image of astronomers and the reality is that the telescopes astronomers use today don't just indiscriminately collect all the light that hits them. In fact, some telescopes don't collect visible light at all. Some, like the Arecibo Observatory in Puerto Rico or the Very Large Array in Contact, for example, collect radio waves.

From APOD.
These telescopes look very different from visible light telescopes because light at different wavelengths has different properties that determine how that light moves. This necessitates different equipment. You know this just from looking at a prism. We all know a prism splits white light into a rainbow, but the reason it does this is because different wavelengths of light (different colors) bend at different angles depending on the medium they're moving through.

If this has an effect just between different colors of visible light, imagine the effect between visible light and radio waves and x-rays, for example. But at the visible light level, this discrepancy between how light behaves at different wavelengths means that you can collect more accurate information about an object if you look at it through filters that only pass specific ranges of wavelengths. This way you can calibrate your machinery just for those wavelengths and not worry about anything else.

There are a lot of filters astronomers use to look at stars. For this lab, we looked at stars through B and V filters, which eye-rollingly stand for blue and visible filters. It's enough to know that the B filter looks at bluer (shorter wavelength) light and the V filter looks at redder (longer wavelength) light. If a star is brighter in the B filter than the V filter, this corresponds to a hotter star. That's because stars roughly follow Wien's law, which says that a blackbody's peak wavelength--the wavelength at which it emits the most light--is inversely proportional to its temperature. So the more light at shorter wavelengths, the higher the temperature.

This observation lets us construct a particular H-R diagram called a Color-Magnitude diagram. For boring and annoying reasons (blame Hipparchus), astronomers measure the brightness of objects with the magnitude system, where smaller values represent brighter objects. For our CMD, the y-axis is the magnitude of light coming through the V filter (so higher on the graph is brighter, which means lower magnitudes). The x-axis, which is supposed to be temperature, is instead the quantity B-V.

Recall, if there's more blue light than red light, the star is hotter. More blue light means a lower B magnitude than V magnitude, which means hot stars will have a low B-V. Since temperature is plotted from hot to cold on the H-R diagram, this means we go from low B-V to high B-V on the x-axis.

So now we are plotting the B and V filter magnitudes of stars in the cluster M41, which we're assuming are all roughly the same age and distance from us. Here's the plot:


Hey, that looks kind of similar to wiki's H-R diagram! There's a clearly visible main sequence starting in the top left and moving down and to the right, and then there's a weird branch in the middle. Those are giants of some variety or another that have turned off of the main sequence. We can predict that this is a relatively young star cluster because it doesn't seem to have much in the way of stellar remnants (stars below the main sequence). What else can this CMD tell us?

For the purposes of the lab, we engaged in a process known as main sequence fitting that lets us figure out the age of and distance to a cluster.

As I mentioned earlier, brighter, hotter stars burn faster than dimmer, cooler stars; they leave the main sequence more quickly. So if all of the stars in a cluster form at roughly the same time, this means young clusters will have a pretty even spread of hot and cool stars, but old clusters will mostly have cool stars, because the hot stars will have stopped burning long ago. On an H-R diagram, this means that the main sequence of a cluster will slowly shrink over time, beginning with the stars in the top left. So where the main sequence ends, called the turn off point, corresponds to the youngest age a cluster could be. If it were any younger, then you would see hotter, shorter-lived stars farther up the main sequence.

This can be taken a step further. Through stellar evolution models (produced by computer simulations), you can plot the absolute magnitudes of various types of stars at a particular age. These models are called isochrones, because they show you a line of stars at a constant age. If you can match the features of your isochrone (such as the turn off point) to the features of your real cluster, you can date the cluster. In our lab, we had isochrones ranging from 100 million years old to 11 billion years old.

So let's date M41. First, let's compare it to the 11 billion year old isochrone (in red).


As you can see, this clearly doesn't fit. It's way farther to the right and way higher up than M41. But let's think about something for a moment. Being way farther to the right means it only has cold stars, which are old stars. We predicted above, because of the lack of stellar remnants, that M41 was probably young, so this makes sense.

By why is the isochrone so much brighter than M41? Here we can be fooled. We are seeing the cluster as bright as our telescopes see it, but the isochrone is a computer model which plots stars as bright as they would be if they were 10 parsecs (about 32.6 lightyears) away. Something seen at 10 pc is said to be seen at "absolute magnitude" for uninteresting historical reasons. If we were to adjust the magnitude of the isochrone, moving it up and down the y-axis, then we would also be adjusting the distance at which we saw it--the farther down the y-axis, the higher the magnitude, the dimmer the isochrone, the farther away it is.

We won't bother with that here, because this isochrone is obviously too old for our cluster. With some fiddling, we can find an isochrone that does fit. Specifically, the 300 million year isochrone.


This looks to have the right shape but is way too bright. So we know that our cluster is farther away than 10 pc. If we adjust the magnitude of our isochrone, we can get a better fit.


This isn't perfect, but the very nice alignment with the main sequence is encouraging. To get this match, we adjusted the magnitude of the isochrone by 9.2, which doesn't mean anything to anybody not steeped in dreadfully tedious astrometrics.

People steeped in dreadfully tedious astrometrics.
But here's the gist. Magnitude is a logarithmic scale, which in this case means that increasing the magnitude of an object by 5 decreases the brightness by a factor of 100. Because light gets dimmer with the square of your distance from it, an object 100 times dimmer is 10 times farther away. Doing the math, this means a 9.2 magnitude difference works out to the cluster being 69 times farther away than the isochrone, or 690 parsecs from us.

Looking up M41 on wiki (reliable?), it gives a distance of 710 parsecs and and age of 190 to 240 million years old. Not bad.

We then did the same thing for cluster M67. With many more stellar remnants (bottom-left), it looks like M67 is probably older.


After another round of main sequence fitting, this is our closest match.


An isochrone 3.5 billion years old with a distance modulus of 9.7, corresponding to 870 parsecs. Wiki says M67 is 3.2-5 billion years old and 800-900 parsecs away. Again, not bad. In fact, a better fit.

So that's main sequence fitting, one rung in the cosmic distance ladder (real term) astronomers use to show us how insignificant we are (by demonstrating the vast scale of the universe).

Sunday, March 1, 2015

Fun with Fourier

Here's the moment you've all been waiting for, folks, when I get off my philosophical soapbox and return to regaling you with exciting tales of studying math and physics. Oh yeah!

Because it's been awhile since I've done one of these explain-what-I-just-learned-about posts, I'm gonna cover a lot of (too much) ground here. This explainer of mine is going to run through Fourier analysis (learned in my math methods course), quantum degeneracy pressure (learned in my thermo class from last semester), and the fate of stars (learned in Astro 121). Whew. So let's get started.

If you've ever seen an orchestra in concert, you know that before the orchestra begins playing, the conductor has the musicians tune their instruments. One person will play a note, and the rest will adjust their instruments to match that note. Listening to this process, a thought may have occurred to you: if all those instruments are playing the same note, why do they each sound different?

This is a complicated question, but the relatively simple answer is that a musical note, along with being described by a frequency (pitch) and an amplitude (loudness), can also be described by its quality or timbre. But what timbre represents can get us into some meaty and far-reaching math.

Say an instrument of some sort plays a Concert A. That means it produces a sound wave of 440 Hz. 440 Hz is just some process that repeats 440 times per second. And a sound wave is just a repeated change in air pressure. With no other distracting information, we could graph such a phenomenon like this:

Fun with Excel.
But there are a couple of problems with this graph, some physical and some mathematical. Let's talk about the physical problems first. Sound is a wave that travels through a medium: air. Air is known for being something of a pushover; you walk right through it all day long as if it weren't even there. But if you've ever encountered a stiff breeze, you know that air is, in fact, there.

Even if the wind isn't blowing, however, air molecules are still going to resist your attempts to push them along. You will have to accelerate them, and you will have to keep pushing the air as each molecule bumps into the next one, transfers its momentum, and loses some energy along the way. The end result is that while your musical instrument may produce some momentary impulse exactly 440 times per second (unlikely), the air's density and viscosity are going to smear out those pressure changes into something more wave-like:

Thanks, Wikipedia.
Let's get into sound's wave properties a little more. Waves operate under the principle of superposition, which says that you can find the amplitude of any wave phenomenon (loudness for sound, brightness for light, etc.) at any point in space by adding up the amplitudes of all the relevant waves at that point in space. This is why the acoustics of a concert hall matter. If the crest of one wave meets the trough of another wave, then your waves cancel out and you're left with a dead spot. Alternatively, if two crests meet, they combine to be louder than either wave individually. This will become important in a bit, so keep it in mind.

The mathematical objection to the above graph goes like this. If I look at a limited portion of the graph, how do I know what the frequency of the wave is?

Not so useful.
The answer is that I don't know. In fact, the smaller a segment of time I look at, the less I can know about the definite frequency of the wave, which means the more possible frequencies the wave could have.

That right there is an interesting way of phrasing things: the more possible frequencies the wave could have. Why, that almost makes it sound as if the wave could have multiple frequencies. Does that even make sense, though? It does, for the reason we talked about above: the principle of superposition. When two waves meet in one place, they combine into one wave. This happens even if the waves have different frequencies.

The discontinuous impulse above, then, could just be many waves on top of each other, with many different frequencies combining in such a way as to cancel out almost everywhere except at precise points. Does this rescue our perfect Concert A? Not quite.

The next question that springs to mind is, where are all these different frequencies coming from? And the answer is that a musical instrument does not produce a note at a single frequency of 440 Hz but many tones at frequencies (harmonics) related to the fundamental of 440 Hz. There will be a tone at 440/2 Hz, 440/3 Hz, 440/4 Hz, and so on, all at different amplitudes depending on the properties of the instrument. The combination of these many harmonics into a single sound is the main component of the timbre, or quality, of a note.

All these different sound waves add together, shifting a wave away from a perfect sinusoid and toward something with a sharp peak. But to get that sharp peak, you need a lot of waves at a lot of different frequencies and very high amplitudes. A musical instrument is only going to provide strong amplitudes at specific overtones of the fundamental, so you're very unlikely to get the original graph up above.

Mathematically, the process of decomposing a single wave into its constituent waves is known as Fourier analysis. In fact, you can represent any periodic signal--or even any "well-behaved" function at all (and some not so well-behaved ones)--as a series of sinusoids of varying frequency and amplitude. You can even perform what's known as a Fourier transform which produces a power spectrum, a graph of the strength of each frequency present in a signal.

The perfect sine wave, which has one well-defined frequency, will look like a spike when you take its Fourier transform, the power spectrum. On the other hand, the sharp impulse, which is made up of many different frequencies, will have a Fourier transform that is spread out. It is impossible to have a signal that is a spike both in time and in frequency. There's a minimum level of uncertainty across the two representations.

Uncertainty, you say? Yes, like Heisenberg's principle. Heisenberg's uncertainty principle can be looked at as arising from the wave nature of all matter. A wave cannot have an absolutely precise location in space while also having an absolutely precise wavelength (which is related to frequency). This comes directly out of the observation made up above: the smaller a slice of time you look at, the less information there is about a wave's frequency, which means the more possible frequencies a wave can have.

A century's worth of experiment has revealed that matter is, in fact, composed of waves. Just as sound waves can interfere with each other to produce acoustic dead spots, electrons can interfere with each other, too. While there are very small and precise experiments such as the double slit that bear this out, there is a rather stunning example that exists on a cosmic scale, too.

So, another interesting fact about electrons is that they obey the Pauli exclusion principle, which says that no two electrons can occupy the same state. Why this is true and what exactly it means is complicated and beyond my current knowledge level, but fundamentally it means that as you compress matter to a denser and denser state, each electron present has fewer and fewer allowed states. This means the uncertainty in the position of each electron goes down, which means the uncertainty in its frequency goes way up. An electron's frequency is tied to its momentum, so the more you compress an electron, the faster it will move.

For particularly dense matter, like the kind you might find in a white dwarf star, this momentum creates pressure which prevents the star from collapsing. However, there is a limit to this pressure. An electron cannot travel faster than the speed of light, which means that as a star gets denser and denser, the increase in electron degeneracy pressure slows down.

In normal stars, the denser it gets, the hotter it gets, and the hotter it gets, the more the star pushes back against gravity, which subsequently cools the star. But degeneracy pressure doesn't come from temperature; it comes from the quantum nature of matter. So as the star gets denser, it gets hotter, eventually leading to a runaway fusion process that annihilates the star in a supernova--a spectacular explosion that can outshine a galaxy and leaves behind a neutron star.

The limit imposed by the speed of light leads to a maximum possible mass for a white dwarf, about 1.4 solar masses, known as the Chandrasekhar limit. A white dwarf cannot exist with a mass any greater than that, and sure enough, no white dwarfs with a greater mass have ever been found. But what's more, because (almost) all white dwarf supernovae happen at 1.4 solar masses, they all look pretty much identical. In fact, the characteristic explosion of a white dwarf supernova is so reliable that it gives astronomers a standard candle by which to measure distances across the universe. And this reliability is a direct consequence of the wavelike nature of matter.

So there you go: from music to cosmology, by way of Fourier analysis. By the way, if you want to combine music and cosmology, check out this guy's site. Without getting into hairy mathematics, he talks about the power spectrum (Fourier transform) of the cosmic microwave background, and how in a very real sense this can be thought of as the sound of the early universe. It's fun stuff.

Wednesday, January 14, 2015

I think I think, therefore I might be.

StatCounter says I still get the occasional visitor. Sometimes, that visitor isn’t a robot! Anywho, that was quite a lengthy hiatus I went on there—the kind of hiatus where you’re not sure if the person is just taking a break or the person is gone forever. But here I am again, so I guess it was just a break. The last year has been kind of rough, and because of that blogging kind of fell by the wayside. I’d like to think things are picking up again, and I’d like to think blogging might be one of those things which gets picked up. So, to all my devoted sentient readers, here’s a post!

I should probably warn you beforehand that this post is going to involve some religion, a lot of philosophical stuff, some personal stories, and basically no physics. And it will probably be long. So, you know, continue at your own peril.

While I am not a big fan of labels, it would not be disingenuous to say that I fall roughly into the skeptical/science-y/non-religious camp. As a result, I have on occasion engaged in debates with those who are more or less diametrically opposed to me where it concerns the supernatural. An argument I often hear (and a common argument in the evil baby-eating fundie vs. evil baby-eating atheist brawl) is that scientists are guilty of hubris for daring to believe they can unravel the mysteries of god/the supernatural/the universe.

It is the height of arrogance, some believe, that we believe we can know how life or the universe began. I say life and universe here, because those are current unknowns in science. There’s a pretty good theory as to how life evolved, and a pretty good theory as to what the universe looked like ~14 billion years ago, but we cannot yet say with any certainty exactly how life got started in the first place or what (if anything) was happening more than 14 billion years ago.

But as I said, these are current unknowns. In the past, it might have been the height of arrogance to presume to know how the great diversity of life came to be, or how the planets moved about the heavens, or why the Earth sometimes shook and lightning split the sky. This moving goalpost is known as the god of the gaps. Much of what was once thought to be in the domain of the divine has yielded to scientific explanation, so that now supernatural causes can only be posited in current gaps in scientific understanding (unless you don’t go in for teleological arguments at all).

Now, I’m not going to spend much time directly refuting this kind of argument. Instead, I’d like to offer an alternative viewpoint as to what such an attitude entails. Neil deGrasse Tyson gives a lecture about what he sees as the problem of intelligent design, and he spends part of this lecture giving examples of otherwise great scientists (such as Newton) who, when confronted with a problem they could not solve, called upon the god of the gaps as a solution. What happens more frequently, however, is not that we fail to find a solution to a problem, but that we fail to imagine a solution and invoke the divine instead.

I claim that this attitude is a far more damning instance of hubris than the scientist who believes he can solve a difficult problem. In essence, this attitude says that if I cannot solve a problem, then no one can, that the problem is impossible to solve. If you ever find yourself lacking clear examples of arrogance, there you go.

Now, don’t get me wrong, there are definitely arrogant scientists out there, and I have no desire to defend such arrogance (as you will see shortly). But I do believe the attitude of science (in some Platonic sense unplagued by the troubles of the real world) is not that science can unravel all problems and explain all mysteries, but that it’s worth it to try to do so.

And in the 400 years since we have institutionalized and made rigorous this can-do attitude, we seemed to have made some incredible progress. We have gone from galloping horses (~45 kph) being the fastest mode of transportation to space probes hurtling out of the solar system (~60,000 kph). We’ve gone from infant and childhood mortality being so prevalent that average life expectancy was 30-40 years, to now, where you can reasonably expect, even at birth, to live to 70 years. Yadda yadda; science is great; you’re reading this on your magic, world-connected box.

Here’s where I stop bashing religion and transition to a personal anecdote because science says convincing you of something by appealing to your emotions is more effective than appealing to your reason. Also, I’m trying to make a more general point.

In my preface above, I mentioned that the last year had been rough. Now, as some of you (and the Google robots) know, I have been battling bouts of depression for something like 15 years. For much of that time, I resisted treatment. I refused to talk about it, I conveniently forgot to refill my antidepressants, and I believed my therapists were incapable of helping me.

Why did I engage in all of these self-destructive behaviors? Because, despite having some pretty severe self-esteem issues, I was thoroughly convinced of my own genius. And because I had not managed to cure my depression with my own big brain, I came to believe that it was, in fact, impossible to cure my depression.

Sound familiar? This is basically the same hubris present in the god of the gaps argument. I don’t believe this is coincidental. My stubborn refusal to believe that anything could help me and the belief that as of yet unsolved problems are not even scientific stem from a common belief: that human reason is a pure and perfect pinnacle of intelligence. It might not be entirely obvious that this is so, so let’s explore the notion a bit.

It’s hard to find solid data on this issue, but I think it’s fair to say that most people believe in some notion of free will. There is the dualist perspective employed by many religions, which says that we have a body and a soul, that the body is bound by physical laws, but that the soul is free to make choices. There are also notions, probably more common now than they used to be, that the universe is deterministic but for the human mind. We might not necessarily have a soul, but we have some essence isolated from external factors, such that we can always choose otherwise even in limited circumstances. I will concede that most people probably don’t sit around contemplating the issue of free will (once they’ve graduated from their pot-smoking college days), but even so, they hold to the idea that people are responsible for their actions and that we can judge them based on said actions. To believe thusly (except in a purely pragmatic sense intended to keep society running) ultimately means you believe there is some person-centered force at work beyond the clockwork laws of the universe.

And that’s the key notion. There is the universe, and then there’s you. It’s hard to escape this perspective. After all, we peer out into the universe through our eyes. Everything that we perceive falls into us. And without the aid of mind-altering substances, we firmly believe in a sense of self that is distinct from the world around us. And what constitutes this sense of self, what makes it feel real, are the thoughts that go running through our heads. There is a universe of stuff out there, and there is a universe of thoughts in here.

Thinking, then, is a special and uniquely human act. Perhaps some other animals engage in it as well, we think, but they don’t do it like we do it. Historically, the capacity to reason has been thought of as one of the defining characteristics of the human animal. We believe we are capable of cleanly deducing the truth given the facts, or making the right decision given all the evidence. This is why naive economic models mostly assume rational agents, and why we generally trust that juries can work.

And this is the connection to the hubris I described above. While we are certainly not blind to the idea that emotions can influence our thinking, we believe that if we are able to control our emotions, the human brain—isolated as it is from the rest of the universe—will arrive at the correct answer given the correct data. If we apply reason, we will be correct. Reason is a binary force that is either on or off. Thus, if we use our reason but we cannot find an answer, the only possible explanation is that there is no answer.

Unfortunately, scientific research over the last half century or so has shown that humans are actually spectacularly bad at rational thinking. We can do it, yes, but only just barely. We may even be unique in our capacity to do it at all (probably not), but it is not a trait honed to perfection by evolution. For one, evolution tends not to hone things to perfection. And two, evolution hasn’t had much time to hone our reason at all.

So we can think, but our thinking is plagued by a whole host of cognitive biases that distort our thinking away from what would be purely rational. There are two things which are important to note here, though. One is that these cognitive biases are not necessarily emotional influences getting in the way of our perfect reasoning. Instead, it’s better to think of them as illusions of thought. And that’s the second point. Illusions in general don’t represent some failure of evolution to make a module (sight, sound, reason) perfect, but evolution developing a heuristic that works most of the time toward the end of ensuring survival and reproduction. Cognitive biases are not necessarily bad; they’re just ways of thinking geared toward an end other than perfect rationality.

If you look at the capacity to reason as an evolved module like any other, it becomes clear that there is no reason to expect it to function “perfectly.” The rest of our modules are far from perfect, after all, because they don't have to be. Our sight, for example, does not reproduce in our mind’s eye some direct analog of the world out there. We see only a tiny fraction of the electromagnetic spectrum, our perception of the colors of objects is altered by nearby objects, we have a blind spot in the middle of our vision that our brains simply fill in, etc.

Our sight is still enormously useful, both in keeping us alive and in giving us some picture of the real world, but ultimately, there are feats our eyes cannot accomplish. No matter how hard we look at an object, we will never see it in radio waves. Some illusions will always fool us. Just the same, there is no reason to believe that the evolved module of reason is perfectly capable of the task of reason. There are limits to what we can accomplish with our own thoughts, for the simple reason that thoughts exist on a biological substrate and not in some dualistic netherworld.

Possibly the most glaring fault in our vision, however, is our belief that it accurately and completely reflects the real world. And this is a common theme in human consciousness. Despite the patchy and inconsistent data our senses actually relay to the brain, despite how inaccurately our memories correspond to history, despite how biased our thinking can be, our brain is designed to convey a sense of consistency and definiteness in the world it creates for us, and we trust it.

This trust is dangerous. It means we can fool ourselves into believing problems are intractable. It means we can fool ourselves into believing we can think our way out of any problem. It means that if something works for one person, we'll believe it should work for every person. It means we can condemn people to death on the “strength” of eyewitness testimony. It means we can feel comfortable declaring people evil because we’re sure we’re capable of choosing to be good.

Some say scientists are arrogant. And some scientists are, of course. But the story of science is not about unparalleled geniuses using the hammer of their perfect intellect to crush the insignificant nails of ignorance (this is a terrible metaphor, but I laughed while writing it, so you’re stuck with it).

The story of science as I see it is of believing that it’s worth it to try to figure things out. From that stance alone we admit our own ignorance. The world might not be only what it appears to be, so let’s try to figure out what it actually is. Our brains might be fallible, so let’s try to account for those failures when we seek answers. We might be ill-equipped to solve some mystery on our own, so let's share our findings and see what others discover, too.

Science done right is the deconstruction of hubris.

Thursday, November 14, 2013

Complexification


This post may seem a little out there, but that might be the point.

Last week in differential equations we learned about a process our textbook called complexification. (You can go ahead and google that, but near as I can tell what you’ll find is only vaguely related to what my textbook is talking about.) Complexification is a way to take a differential equation that looks like it’s about sines and cosines and instead make it about complex exponentials. What does that mean?

Well, I think most people know a little bit about sine and cosine functions. At the very least, I think most people know what a sine wave looks like.

Shout out to Wikipedia.
Such a wave is produced by a function that looks something like f(x) = sin(x). Sine and cosine come from relationships between triangles and circles, but they can be used to model periodic, fluctuating motion. For example, the way in which alternating current goes back and forth between positive and negative is sinusoidal.

On the other hand, exponential functions don’t seem at all related. Exponential functions look something like f(x) = ex, and their graphs have shapes such as this:

Thanks again, Wikipedia.

Exponential functions are used to model systems such as population growth or the spread of a disease. These are systems where growth starts out small, but as the quantity being measured grows larger, so too does the rate of growth.

Now, at first blush there doesn’t appear to be a lot of common ground between sine functions and exponential functions. But it turns out there is, if you throw in complex numbers. What’s a complex number? It’s a number that includes i, the imaginary unit, which is defined to be the square root of -1. You may have heard of this before, or you may have only heard that you can’t take the square root of a negative number. Well, you can: you just call it i.

So what’s the connection? The connection is Euler’s formula, which looks like this:

eix = cos(x) + isin(x).

Explaining why this formula is true turns out to be very complicated and a bit beyond what I can do. So just trust me on this one. (Or look it up yourself and try to figure it out.) Regardless, by complexifying, you have found a connection between exponentials and sinusoids.

How does that help with differential equations? The answer is that complexifying your differential equation can often make it simpler to solve.

Take the following differential equation:

d2y/dt2 + ky = cos(x).

This could be a model of an undamped harmonic oscillator with a sinusoidal forcing function. It’s not really important what that means, except to say you would guess (guessing happens a lot in differential equations) that the solution to this equation involves sinusoidal functions. The problem is, you don’t know if it will involve sine, cosine, or some combination of the two. You can figure it out, but it takes a lot of messy algebra.

A simpler way to do it is by complexifying. You can guess instead that the solution will involve complex exponentials, and you can justify this guess through Euler’s formula. After all, there is a plain old cosine just sitting around in Euler’s formula, implying that the solution to your equation could involve a term such as eix.

This idea of complexification got me thinking about the topic of explaining things to people. You see, I think I tend to do a bit of complexifying myself a lot of the time. Now, I don’t mean I throw complex numbers into the mix when I don’t technically have to; rather, I think I complexify by adding more than is necessary to my explanations of things. I do this instead of simplifying.

Why would I do this? After all, simplifying your explanation is going to make it easier for people to understand. Complexifying, by comparison, should make things harder to understand. But complexifying can also show connections that weren’t immediately obvious beforehand. I mean, we just saw that complexifying shows a connection between exponential functions and sinusoidal functions. Another example is Euler’s identity, which can be arrived at by performing some algebra on Euler’s formula. It looks like this:

eiπ + 1 = 0

This is considered by some to be one of the most astounding equations in all of mathematics. It elegantly connects five of the most important numbers we’ve discovered. Stare at it for awhile and take it in. Can that identity really be true? Can those numbers really be connected like that? Yup.

That, I think, is the benefit of complexifying: letting us see what is not immediately obvious.

It turns out last week was also Carl Sagan’s birthday. This generated some hubbub, with some praising the man and others wishing we would just stop talking about him already. Carl Sagan was admittedly before my time, but he has had an impact on me nonetheless. No, he didn’t inspire me to study science or pick up the telescope or anything like that. But I am rather fond of his pale blue dot speech, to the extent that there’s even a minor plot point about it in one of my half-finished novels.

Now, I read some rather interesting criticism of Sagan and his pale blue dot stuff on a blog I frequent. A commenter was of the opinion that Sagan always made science seem grandiose and inaccessible. That’s an interesting take, but I happen to disagree. Instead, I think we might be able to conclude that Sagan engaged in a bit of complexifying. No, he certainly didn’t make his material more difficult to understand than it had to be; he was a very gifted communicator. What he did do, however, and this is especially apparent with the pale blue dot, is make his material seem very big, very out there. You might say he added more than was necessary.

In doing so, he showed connections that were not immediately obvious. The whole point of his pale blue dot speech is that we are very small fish in a very big pond, and that this connects us to each other. The distances and differences between people are, relatively speaking, absolutely miniscule. From the outer reaches of the solar system, all of humanity is just a pixel.

But there are more connections to be made. Not only are all us connected to each other; we’re also connected to the universe itself. Because, you see, from the outer reaches of the solar system, we’re just a pixel next to other pixels, and those other pixels are planets, stars, and interstellar gases. We’re all stardust, as has been said.

This idea that seeing the world as a tiny speck is transformative has been called by some (or maybe just Frank White) the overview effect. Many astronauts have reported experiencing euphoria and awe as a result of this effect. But going to space is expensive, especially compared to listening to Carl Sagan.

So yeah, maybe Sagan was a bit grandiose in the way he doled out his science. But I don’t think that’s a bad thing. I just think it shows the connection between Sagan and my differential equations class.